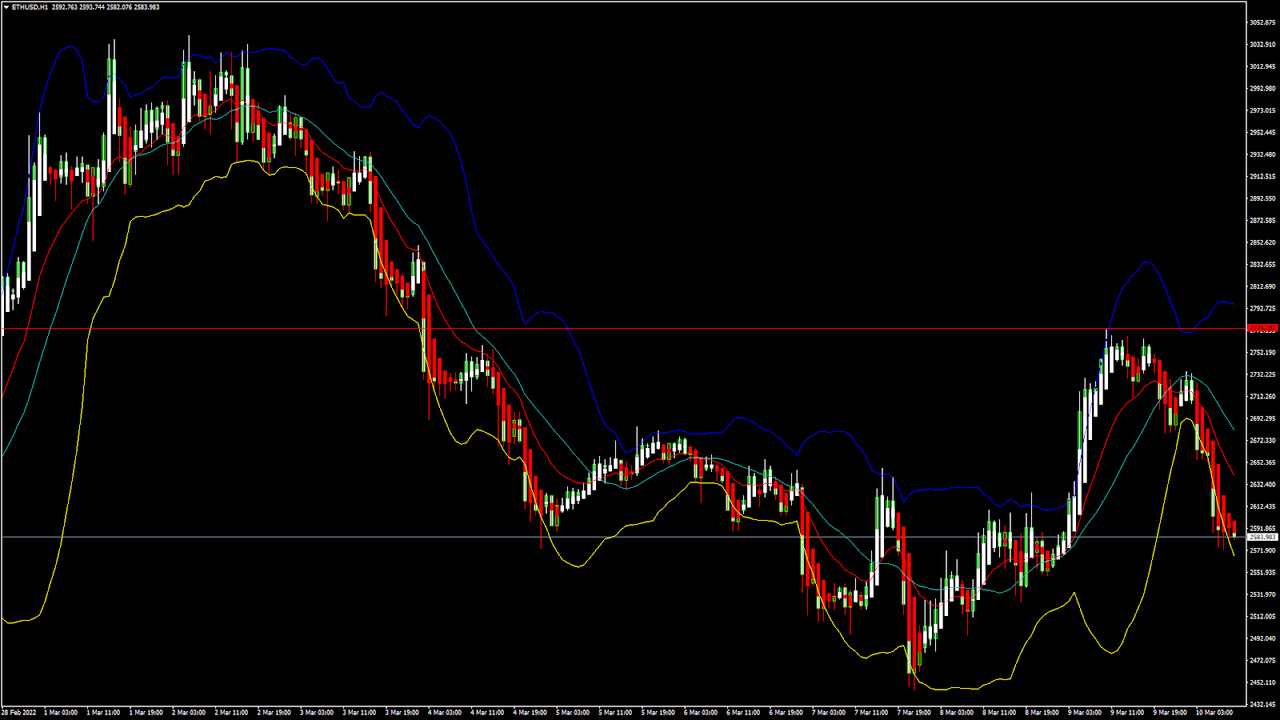
ETHUSD and LTCUSD Technical Analysis ? 10th MAR, 2022 ETHUSD: Head and Shoulders Pattern Below $2,700
Ethereum continued to move in a bearish phase last week, having touched a low of $2,448 on March 7th, after which the prices started to consolidate above the level of $2,500.
We can see ETHUSD moving in a bearish momentum because of the Russia-Ukraine war and its effects on the global investor sentiments.
Despite the fact that some correction was seen in the USD, the medium-term outlook for Ethereum remains bearish with a downside projection of $2,200.
We can clearly see a head-and-shoulders pattern below the $2,700 handle which is a bearish pattern signifying the end of a bullish phase and the start of a bearish phase in the markets.
ETH is now trading just below its pivot level of $2,588 and is moving in a bearish channel. The price of ETHUSD is now testing its classic support level of $2,558, and Fibonacci support level of $2,580 after which the path towards $2,300 will get cleared.
The relative strength index is at 34 indicating a WEAKER demand for Ethereum, as well as the continuation of the selling pressure in the markets.
All of the technical indicators are giving a STRONG SELL market signal.
All of the moving averages are giving a STRONG SELL signal, and we are now looking at the levels of $2300 to $2200 in the short-term range.
ETH is now trading below both its 100 hourly and 200 hourly simple moving averages.
- A bearish reversal seen below the $2700 mark in Eth
- Short-term range appears to be strongly BEARISH
- The daily RSI is below 50 at 44 indicating a BEARISH market
- The average true range is indicating LESSER market volatility
Ether: Bearish Momentum Continues Below $2,700
ETHUSD is now moving in a strongly bearish momentum, with the prices trading below the $2,600 handle in the European trading session today.
Both the Stoch and StochRSI are indicating an OVERSOLD market, which means that a pullback in the levels of Ethereum is expected soon.
The Ethereum bulls have retracted, and we can see that the selling pressure has resumed which is expected to push down the prices below the $2,500 handle.
The prices of ETHUSD need to remain above $2,200 for any bullish reversal in the markets.
At present, we are looking for the immediate target of $2,300 after which it is expected to enter into a consolidation and correction phase.
This week, the key support level to watch is $2,200, and the key resistance level is $2,700.
ETH has declined -5.24% with a price change of -143.26$ in the past 24hrs, and has a trading volume of 13.621 billion USD.
We can see an Increase of 16.69% in the total trading volume in the last 24 hrs, which appears to be normal.
The Week AheadEthereum has already exhausted its consolidation channel and is now moving into its next bearish phase towards the level of $2,300.
The ongoing Russia-Ukraine war crisis is continuing to affect the prices of Ethereum, as new investors are not willing to enter into the market because of the global crisis scenario and the waning demand in the global cryptocurrency markets.
If the prices of ETHUSD continue to remain above $2,200 this week, we can expect a bullish reversal next week.
The immediate short-term outlook for Ether has turned strongly BEARISH; the medium-term outlook has turned bearish; and the long-term outlook for Ether is NEUTRAL in present market conditions.
This week. Ether is expected to move in a range between $2,200 and $2,700, and next week, it is expected to enter into a consolidation phase above $2,500.
Technical Indicators:The moving averages convergence divergence (12,26): at -16.78 indicating a SELL
The commodity channel index (14-day): at -117.12 indicating a SELL
The rate of price change: at -4.37 indicating a SELL
The average directional change (14-day): at 45.85 indicating a SELL
Read Full on FXOpen Company Blog...