Forex Zone - Forex Forum

GBP/USD SIGNAL

Discussion started on Trading Signals

  • Newbie
  • Posts: 12
  • Points: 0
  • Likes Received: 1
  • Reputation: +0/-0
Sell for GU. 
There was no significant movement in the GU in yesterday's trading session, but there is a tendency for the GU to start entering the bearish phase. 
If the GU can go down and penetrate 1.2850. 
GU has the chance to weaken towards 1.2750.

Linkback: https://www.forex.zone/trading-signals/23/gbpusd-signal/2762/
#1 - October 23, 2019, 01:52:03 AM
Attachments:

  • Newbie
  • Posts: 12
  • Points: 0
  • Likes Received: 1
  • Reputation: +0/-0
Sell for GU.
There was no significant movement in the GU in yesterday's trading session, but there is a tendency for the GU to start entering the bearish phase.
If the GU can go down and penetrate 1.2850.
GU has the chance to weaken towards 1.2750.
GBP USD has passed the price of 1.2850 and is now at the price of 1.2845. there has been no strong downward movement.
how is it good to sell now?
#2 - October 23, 2019, 03:55:13 AM

  • Newbie
  • Posts: 30
  • Points: 0
  • Likes Received: 1
  • Reputation: +0/-0
GBP / USD currency pair today, The dominant trend this week is in a weak or declining position. 
The trend on Wednesday is controlled by the power of the buyer, but the range of values on Tuesday is only 80 pips and previously reached 100 points on Tuesday, thus for the choice of trending options when selling sell. 
Entry Settings: 
Sell 1.2915
Target Profi 1.2882 
Stop loss at the red line 1.3010
#3 - October 24, 2019, 12:43:32 AM
Attachments:

  • Full Member
  • Posts: 110
  • Points: 1006
  • Likes Received: 45
  • Reputation: +1/-0
GbpUsd longterm

Sell limit 1.31010
Stoploss 1.31770

Buy limit 1.25600
Stoploss 1.2500

GbpUsd middle term

Buy tommorow 1.27800
Stoploss 1.27400
#4 - October 27, 2019, 03:17:24 PM

  • Hero Member
  • Posts: 1025
  • Points: 2067
  • Likes Received: 296
  • Reputation: +6/-4
sell order GBPUSD 
TP. based timeframe H4 sell GBPUSD
TP1 : 1.2688
TP2 : 1.2562
STOPLOSE : 1.3022
GBPUSD still downtrend at H4 which below middle band BB(default),RSI below level 50% and stochastic crossing over

#5 - October 29, 2019, 03:23:03 AM
Attachments:

  • Newbie
  • Posts: 40
  • Points: 500
  • Likes Received: 5
  • Reputation: +0/-0
GBPUSD is undergoing a Bullish trend phase. The price of 1.2867 is now above the Moving Average Daily. We observe the GBPUSD chart currently moving from 1.2811 to 1.2875, The CCI indicator is currently above the Zero Level (100.04). Meanwhile prices are above Parabolic SAR. GBPUSD in the last 24 hours formed a Range of 64 pips. From market conditions and indicators above we can BUY with a target of 1.2910
#6 - October 29, 2019, 03:31:11 AM
Attachments:

  • Full Member
  • Posts: 198
  • Points: 0
  • Likes Received: 25
  • Reputation: +1/-0
#GBPUSD 
GBPUSD is now at the resistance level and the resistance line, and after the price is reached at the key level of 1.290, 
I expect the decline to continue. In the short term, the price must reach the level of 1,278. 

SELL LIMIT 1.290
TP 1.278
#7 - October 29, 2019, 04:37:00 AM
Attachments:

  • Full Member
  • Posts: 198
  • Points: 0
  • Likes Received: 25
  • Reputation: +1/-0
#GBPUSD 
Short-term trading analysis. 
I expect GBPUSD will fall to the support line, this is a form of correction and find a foothold in the trend. 

Setup the SELL strategy 1.2940-1.2960 
Target 1: 1.1290 
Target 2: 1.1289
#8 - November 04, 2019, 07:48:52 AM
Attachments:

  • Hero Member
  • Posts: 9575
  • Points: 59
  • Likes Received: 728
  • Reputation: +10/-20
GBP / USD is expected to move in the area of 1.2840-1.3010. The trading plan will place a Pending Order at: Buy Stop (OP 1): 1.2960, Take Profit: 1.3010 (50 Pips). Sell Stop (OP 2): 1.2890, Take Profit: 1.2840 (50 Pips). Stop Loss: 25-50 Pips.
GBP/USD SIGNAL in Trading Signals_Screenshot-1668
#9 - November 04, 2019, 10:20:54 PM

  • Full Member
  • Posts: 202
  • Points: 35638
  • Likes Received: 133
  • Reputation: +323/-2
GBP/USD SIGNAL in Trading Signals_GU
GBPUSD ANALYSIS

GBPUSD is undergoing a Bearish trend phase.
The price of 1.2884 is now below the Moving Average Daily.
We observe the GBPUSD chart currently moving from 1.2942 to 1.2884,
The CCI indicator is currently below the Zero Level (-183.31).
Meanwhile prices are under Parabolic SAR.
GBPUSD in the last 24 hours formed a Range of 58 pips.

From the market conditions and indicators above we can SELL with a target of 1.2840.


#10 - November 05, 2019, 10:33:12 AM
« Last Edit: November 05, 2019, 12:09:28 PM by Admin »

  • Full Member
  • Posts: 202
  • Points: 35638
  • Likes Received: 133
  • Reputation: +323/-2
GBP/USD SIGNAL in Trading Signals_GU
GBPUSD ANALYSIS

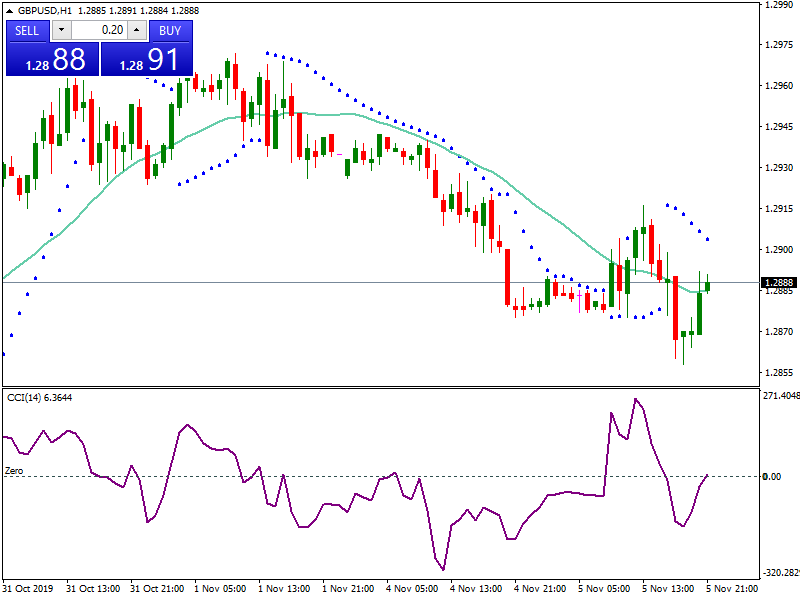
GBPUSD is undergoing a Bearish trend phase.
Price of 1,289 is now above the Daily Moving Average.
We observe the GBPUSD chart currently moving from 1.2916 to 1.2858,
The CCI indicator is currently above the Zero Level (10.80).
Meanwhile prices are under Parabolic SAR.
GBPUSD in the last 24 hours formed a Range of 58 pips.

From the market conditions and indicators above we can SELL with a target of 1.2840.
#11 - November 06, 2019, 09:16:01 AM
« Last Edit: November 06, 2019, 11:03:40 AM by Admin »

  • Full Member
  • Posts: 202
  • Points: 35638
  • Likes Received: 133
  • Reputation: +323/-2
GBP/USD SIGNAL in Trading Signals_GU

GBPUSD ANALYSIS

GBPUSD is undergoing a Bearish trend phase.
The price of 1.2857 is now below the Moving Average Daily.
We observe the GBPUSD chart currently moving from 1.2896 to 1.2843,
The CCI indicator is currently below the Zero Level (-65.43).
Meanwhile prices are under Parabolic SAR.
GBPUSD in the last 24 hours formed a Range of 53 pips.

From market conditions and indicators above we can SELL with a target of 1.2810.
#12 - November 07, 2019, 08:26:17 AM
« Last Edit: November 07, 2019, 11:47:28 AM by Admin »

  • Full Member
  • Posts: 202
  • Points: 35638
  • Likes Received: 133
  • Reputation: +323/-2
GBP/USD SIGNAL in Trading Signals_GU

GBPUSD ANALYSIS

GBPUSD is undergoing a Bearish trend phase.
The price of 1.2814 is now below the Moving Average Daily.
We observe the GBPUSD chart currently moving from 1.2877 to 1.2793,
The CCI indicator is currently below the Zero Level (-60.71).
Meanwhile prices are under Parabolic SAR.
GBPUSD in the last 24 hours formed a range of 84 pips.

From the market conditions and indicators above we can SELL with a target of 1.2770.
#13 - November 08, 2019, 08:58:38 AM
« Last Edit: November 08, 2019, 12:08:44 PM by Admin »

  • Full Member
  • Posts: 110
  • Points: 1006
  • Likes Received: 45
  • Reputation: +1/-0
Gbp/Usd Trendline
Gbp / Usd seems to have broken the trendline and formed a double top pattern perfectly as shown below. Thus our focus on either short them or longterm is SELL. I suggest installing a sell limit in the gray supply area that I have made.
Signal:
Sell limit: 1,28400
Stop loss 1,28700
Take profit 1.26000
#14 - November 11, 2019, 07:45:05 AM
Attachments:

  • Hero Member
  • Posts: 1048
  • Points: 5674
  • Likes Received: 111
  • Reputation: +4/-0
GBPUSD after yesterday was able to rise after breaking through the MA 24 and the strong resistance area MA 480 and then dropped after failing to penetrate the resistance 1.2898, currently making corrections. but seen on TF h1 the GBPUSD is now between the MA 480 as a strong support and the MA 120 as resistance. If it is seen again the potential for GBPUSD to rise is still seen because the MA 24 has been able to penetrate the MA 480 and the GBPUSD looks approaching the low BB 24 area. penetrate the support area 1.2847 -1.2835 GBPUSD has the potential to rise again and possibly will test the resistance at 1.2898 - 1.2929 but if GBPUSD breaks the MA 480 and BB low area then GBPUSD will go to 1.2816 area.

for the buy option can be taken in the MA area 480 or 1.2847 where SL can be slightly below the next support area around 1.2795. and buy limit can be taken in the area of 1.2816 with SL in the low area of 1.2769 to limit losses.
#15 - November 12, 2019, 09:26:45 AM
Attachments:

Members:

0 Members and 1 Guest are viewing this topic.