Forex Zone - Forex Forum

Daily Market Analytics - Forex in Technical_67f83ac065b44

Daily Market Analytics - Forex

Discussion started on Technical

  • Hero Member
  • Posts: 3580
  • Points: 130047
  • Likes Received: 384
  • Reputation: +8/-2
GBPJPY Technical Analysis ? 26 JUNE, 2026
GBPJPY ? GBP/JPY recorded a high of 213.81 on 26 June 2026, a level that underscores sterling?s resilience against the Japanese yen and highlights the continuation of the bullish momentum that has defined the pair throughout June.
Daily Market Analytics - Forex in Technical_1FYs3fCX_o
 
GBP/JPY recorded a high of 213.81 on 26 June 2026, a level that underscores sterling?s resilience against the Japanese yen and highlights the continuation of the bullish momentum that has defined the pair throughout June. This high is significant because it represents a renewed test of resistance after the 212.57 low earlier in the week, reflecting both technical strength and the macroeconomic divergence between the UK and Japan. The move to 213.81 illustrates the market?s ability to sustain upward momentum while probing levels that have historically capped rallies.

From a technical perspective, the 213.81 high sits just below the resistance band at 214.00?216.00, which has historically acted as a supply zone. The pair has been trading within a rising channel since late May, with the lower boundary near 211.00 and the upper boundary extending toward 216.00. The rebound from 212.57 confirmed buyers? willingness to defend the lower boundary, and the subsequent extension toward 213.81 suggests that buyers remain firmly in control. A sustained daily close above 214.00 would be required to unlock upside potential toward 216.50 and 218.50, levels last tested in early Q2. On the downside, immediate support lies at 212.50, followed by the more critical 211.00 pivot, which has acted as a structural floor during the recent rally. A breakdown below 211.00 would signal a potential reversal, exposing the pair to retracement risks toward 209.50.

Momentum indicators provide further clarity. The Relative Strength Index (RSI) on the daily chart is hovering near 64, reflecting strong bullish momentum but not yet in extreme overbought territory. This suggests that while buyers remain in control, there is still room for further gains before exhaustion sets in. The MACD histogram remains firmly positive, with the signal line diverging above the zero axis, reinforcing the bullish bias. Volume analysis shows increased participation during the rally toward 213.81, indicating that the move was supported by conviction rather than thin liquidity, a sign that buyers are committed to sustaining the trend.

The macroeconomic backdrop adds depth to the technical picture. The British pound has benefited from stabilizing growth in the UK economy, with inflation moderating and the Bank of England maintaining a cautious but steady policy stance. Fiscal uncertainty remains, but improved investor sentiment has lent support to sterling. Meanwhile, the Japanese yen continues to suffer from the Bank of Japan?s ultra loose monetary policy, which has kept interest rates near zero despite rising global yields. This divergence in monetary policy has widened yield differentials, making the pound more attractive relative to the yen. Additionally, global risk appetite has diminished the yen?s safe haven appeal, further weakening its position against higher yielding currencies.

Trading implications are clear. Short term traders may look to capitalize on momentum by buying dips near 212.50?212.00 with tight stops, targeting extensions toward 214.00?216.00. Swing traders may adopt a more patient stance, waiting for confirmation above 214.00 to position for a medium term extension toward 218.50. Conversely, a failure to hold above 211.00 would shift bias toward bearish retracement, with 209.50 as the next key battleground.

In conclusion, the GBP/JPY high of 213.81 on 26 June 2026 reflects a market firmly in bullish control, supported by both technical breakout and macroeconomic divergence. Unless the yen finds renewed fundamental support, the path of least resistance remains higher, with 214.00 serving as the next critical target for buyers.

#fxopen #forex #forexanalysis

Disclaimer: This analysis represents my own opinion only. It is not to be construed as an opinion, offer, solicitation, recommendation, or financial advice of the Companies operating under the FXOpen brand.

For in-depth analysis, please check ...
#256 - July 02, 2026, 05:10:16 AM

  • Hero Member
  • Posts: 3580
  • Points: 130047
  • Likes Received: 384
  • Reputation: +8/-2
GBPUSD Technical Analysis ? 26 JUNE, 2026
GBPUSD ? GBP/USD recorded a high of 1.3226 on 26 June 2026, a level that underscores sterling?s resilience against the U.S. Dollar and highlights the continuation of the corrective rally that began after the 1.3143 low earlier in the week.
Daily Market Analytics - Forex in Technical_pB52Zk3k_o
 
GBP/USD recorded a high of 1.3226 on 26 June 2026, a level that underscores sterling?s resilience against the U.S. Dollar and highlights the continuation of the corrective rally that began after the 1.3143 low earlier in the week. This high is significant because it represents a renewed test of resistance within the broader structure, reflecting both technical strength and the macroeconomic divergence between the UK and U.S. economies. The move to 1.3226 illustrates the market?s ability to sustain upward momentum while probing levels that have historically capped rallies.

From a technical perspective, the 1.3226 high sits just below the resistance band at 1.3250?1.3300, which has historically acted as a supply zone. The pair has been trading within a fragile ascending channel since mid June, with the lower boundary near 1.3140 and the upper boundary extending toward 1.3300. The rebound from 1.3143 confirmed buyers? willingness to defend the lower boundary, and the subsequent extension toward 1.3226 suggests that buyers remain firmly in control. A sustained daily close above 1.3250 would be required to unlock upside potential toward 1.3300 and 1.3350, levels last tested in early Q2. On the downside, immediate support lies at 1.3180, followed by the more critical 1.3140 pivot, which has acted as a structural floor during the recent rally. A breakdown below 1.3140 would signal a potential reversal, exposing the pair to retracement risks toward 1.3090.

Momentum indicators provide further clarity. The Relative Strength Index (RSI) on the daily chart is hovering near 56, reflecting neutral to bullish momentum and suggesting that buyers are regaining control. The MACD histogram has turned positive, with the signal line crossing above zero, reinforcing the bullish bias. Volume analysis shows increased participation during the rally toward 1.3226, indicating that the move was supported by conviction rather than thin liquidity, a sign that buyers are committed to sustaining the trend.

The macroeconomic backdrop adds depth to the technical picture. The British pound has benefited from stabilizing growth in the UK economy, with inflation moderating and the Bank of England maintaining a cautious but steady policy stance. Fiscal uncertainty remains, but improved investor sentiment has lent support to sterling. Meanwhile, the U.S. Dollar?s trajectory is shaped by shifting expectations around Federal Reserve policy. With inflation showing signs of moderation, markets are increasingly pricing in the possibility of a rate cut later in 2026. This has softened USD demand, but the Fed?s cautious stance prevents a wholesale bearish shift. The divergence between UK resilience and U.S. caution has reinforced GBP/USD?s bullish bias, even as corrective dips emerge.

Trading implications are clear. Short term traders may look to capitalize on momentum by buying dips near 1.3180?1.3140 with tight stops, targeting extensions toward 1.3250?1.3300. Swing traders may adopt a more patient stance, waiting for confirmation above 1.3250 to position for a medium term extension toward 1.3350. Conversely, a failure to hold above 1.3140 would shift bias toward bearish retracement, with 1.3090 as the next key battleground.

In conclusion, the GBP/USD high of 1.3226 on 26 June 2026 reflects a market firmly in bullish control, supported by both technical breakout and macroeconomic divergence. Unless the dollar finds renewed fundamental support, the path of least resistance remains higher, with 1.3250 serving as the next critical target for buyers.

#fxopen #forex #forexanalysis

Disclaimer: This analysis represents my own opinion only. It is not to be construed as an opinion, offer, solicitation, recommendation, or financial advice of the Companies operating under the FXOpen brand.

For in-depth analysis, please check ...
#257 - July 02, 2026, 05:13:28 AM

  • Hero Member
  • Posts: 3580
  • Points: 130047
  • Likes Received: 384
  • Reputation: +8/-2
NZDUSD Technical Analysis ? 26 JUNE, 2026
NZDUSD ? NZD/USD recorded a high of 0.5658 on 26 June 2026, a level that underscores the New Zealand Dollar?s attempt to recover against the U.S. Dollar after testing deeper lows earlier in the week.
Daily Market Analytics - Forex in Technical_uNn8W8bT_o
 
NZD/USD recorded a high of 0.5658 on 26 June 2026, a level that underscores the New Zealand Dollar?s attempt to recover against the U.S. Dollar after testing deeper lows earlier in the week. This high is significant because it represents a rebound from the 0.5630 region, reflecting renewed buying interest and short covering, though the broader structure still shows the pair struggling to establish a sustained bullish trend. The move to 0.5658 illustrates the market?s sensitivity to resistance levels while underscoring the macroeconomic divergence shaping the pair.

From a technical perspective, the 0.5658 high sits just below the resistance band at 0.5670?0.5700, which has historically acted as a supply zone. The pair has been trading within a descending channel since late May, with the lower boundary near 0.5570 and the upper boundary extending toward 0.5750. The rebound from 0.5630 confirmed buyers? willingness to defend the lower boundary, but the inability to break above 0.5700 highlights the persistence of sellers at higher levels. This level now serves as immediate resistance, with any decisive break above it likely to expose the pair to further upside toward 0.5750, a structural pivot that would signal a more sustained bullish recovery. On the downside, immediate support lies at 0.5630, followed by the more critical 0.5570 zone, which has acted as a demand floor during the recent downtrend.

Momentum indicators provide additional clarity. The Relative Strength Index (RSI) on the daily chart sits near 48, reflecting neutral to bearish momentum and suggesting that the market is consolidating rather than trending strongly. The MACD histogram remains slightly negative, though the signal line is beginning to flatten, hinting at a potential shift toward bullish momentum if buying pressure persists. Volume analysis shows moderate activity during the rally toward 0.5658, indicating that the move was driven more by opportunistic buying than by aggressive accumulation, a sign that conviction remains limited.

The macroeconomic backdrop adds depth to the technical picture. The New Zealand Dollar has been weighed down by subdued domestic growth and cautious Reserve Bank of New Zealand policy, which has kept interest rates steady despite global shifts. Commodity exports, particularly dairy and agricultural products, remain supportive, but weaker demand from key trading partners has limited upside potential. Meanwhile, the U.S. Dollar?s trajectory is shaped by shifting expectations around Federal Reserve policy. With inflation showing signs of moderation, markets are increasingly pricing in the possibility of a rate cut later in 2026. This has softened USD demand, but the Fed?s cautious stance prevents a wholesale bearish shift. The divergence between New Zealand?s commodity linked economy and U.S. resilience has reinforced the structural pressure on NZD/USD, making rallies difficult to sustain.

Trading implications are clear. Short term traders may look to capitalize on range bound strategies, selling rallies near 0.5670?0.5700 with tight stops while targeting retracements toward 0.5630. Swing traders may prefer to wait for a confirmed break above 0.5700 to position for a medium term extension toward 0.5750. Conversely, a failure to hold above 0.5630 would shift bias toward bearish retracement, with 0.5570 as the next key battleground.
In conclusion, the NZD/USD high of 0.5658 on 26 June 2026 reflects a market undergoing short term recovery within a broader consolidative framework. Technical indicators, price structure, and macro fundamentals collectively suggest that while corrective rallies are possible, the path of least resistance remains sideways to lower unless buyers can decisively reclaim the 0.5700?0.5750 zone.

#fxopen #forex #forexanalysis

Disclaimer: This analysis represents my own opinion only. It is not to be construed as an opinion, offer, solicitation, recommendation, or financial advice of the Companies operating under the FXOpen brand.

For in-depth analysis, please check ...
#258 - July 02, 2026, 05:18:37 AM

  • Hero Member
  • Posts: 3580
  • Points: 130047
  • Likes Received: 384
  • Reputation: +8/-2
USDCAD Technical Analysis ? 26 JUNE, 2026
USDCAD ? USD/CAD recorded a low of 1.4172 on 26 June 2026, a level that underscores the Canadian Dollar?s resilience against the U.S. Dollar and highlights the corrective pullback within a broader bullish framework for USD/CAD.
Daily Market Analytics - Forex in Technical_1QZPiUV0_o
 
USD/CAD recorded a low of 1.4172 on 26 June 2026, a level that underscores the Canadian Dollar?s resilience against the U.S. Dollar and highlights the corrective pullback within a broader bullish framework for USD/CAD. This low is significant because it represents a rejection of higher levels seen earlier in the week, reflecting profit taking and renewed CAD demand, particularly as crude oil prices remained firm. The move to 1.4172 illustrates the market?s sensitivity to support levels while underscoring the macroeconomic divergence shaping the pair.

From a technical perspective, the 1.4172 low sits just above the critical support band at 1.4150?1.4120, which has historically acted as a demand zone. The pair has been trading within a rising channel since late May, with the lower boundary near 1.4120 and the upper boundary extending toward 1.4300. The inability to sustain momentum above 1.4240 earlier in the week reinforced the presence of sellers at higher levels, leading to the corrective dip toward 1.4172. This level now serves as immediate support, with any decisive break below it likely to expose the pair to further downside toward 1.4120, a structural pivot that has repeatedly acted as a floor. On the upside, resistance is clearly defined at 1.4220, followed by 1.4260, which represents a key barrier to recovery and continuation of the uptrend.

Momentum indicators provide additional clarity. The Relative Strength Index (RSI) on the daily chart sits near 52, reflecting neutral to bullish momentum and suggesting that buyers remain in control despite the corrective dip. The MACD histogram remains positive, though the signal line is beginning to flatten, hinting at a potential slowdown in momentum if corrective pressures persist. Volume analysis shows increased participation during the dip to 1.4172, indicating that the move was supported by conviction rather than thin liquidity, a sign that sellers are committed to defending higher levels.

The macroeconomic backdrop adds depth to the technical picture. The U.S. Dollar has benefited from stabilizing growth and expectations around Federal Reserve policy. With inflation showing signs of moderation, markets are increasingly pricing in the possibility of a rate cut later in 2026, but the Fed?s cautious stance has prevented a wholesale bearish shift. Meanwhile, the Canadian Dollar continues to draw support from resilient crude oil prices, which remain elevated due to supply constraints and steady global demand. The Bank of Canada?s cautious monetary stance, combined with slower domestic growth, has limited CAD?s ability to mount a sustained rally, but commodity strength has provided a buffer against USD dominance. This divergence in fundamentals has created a tug of war, with USD/CAD?s trajectory highly sensitive to shifts in oil prices and Fed policy expectations.

Trading implications are clear. Short term traders may look to capitalize on range bound strategies, buying dips near 1.4172?1.4150 with tight stops while targeting rebounds toward 1.4220. Swing traders may prefer to wait for a confirmed break above 1.4260 to position for a medium term extension toward 1.4300. Conversely, a failure to hold above 1.4120 would shift bias toward bearish retracement, with 1.4070 as the next key battleground.
In conclusion, the USD/CAD low of 1.4172 on 26 June 2026 reflects a market undergoing short term consolidation within a broader bullish trend. Technical indicators, price structure, and macro fundamentals collectively suggest that while corrective pressures are present, the path of least resistance remains higher, with 1.4220?1.4260 serving as the next critical targets for buyers.

#fxopen #forex #forexanalysis

Disclaimer: This analysis represents my own opinion only. It is not to be construed as an opinion, offer, solicitation, recommendation, or financial advice of the Companies operating under the FXOpen brand.

For in-depth analysis, please check ...
#259 - July 02, 2026, 05:25:59 AM

  • Hero Member
  • Posts: 3580
  • Points: 130047
  • Likes Received: 384
  • Reputation: +8/-2
USDCHF Technical Analysis ? 26 JUNE, 2026
USDCHF ? USD/CHF recorded a low of 0.8067 on 26 June 2026, a level that underscores the Swiss franc?s resilience against the U.S. Dollar and highlights the corrective pullback within a broader bullish framework for USD/CHF.
Daily Market Analytics - Forex in Technical_a3DdQhN6_o
 
USD/CHF recorded a low of 0.8067 on 26 June 2026, a level that underscores the Swiss franc?s resilience against the U.S. Dollar and highlights the corrective pullback within a broader bullish framework for USD/CHF. This low is significant because it represents a rejection of higher levels seen earlier in the week, reflecting profit taking and renewed franc demand, particularly as safe haven flows re emerged. The move to 0.8067 illustrates the market?s sensitivity to support levels while underscoring the macroeconomic divergence shaping the pair.

From a technical perspective, the 0.8067 low sits just above the critical support band at 0.8050?0.8000, which has historically acted as a demand zone. The pair has been trading within a rising channel since early June, with the lower boundary near 0.8050 and the upper boundary extending toward 0.8180. The inability to sustain momentum above 0.8139 earlier in the week reinforced the presence of sellers at higher levels, leading to the corrective dip toward 0.8067. This level now serves as immediate support, with any decisive break below it likely to expose the pair to further downside toward 0.8050, a structural pivot that has repeatedly acted as a floor. On the upside, resistance is clearly defined at 0.8130, followed by 0.8150, which represents a key barrier to recovery and continuation of the uptrend.

Momentum indicators provide additional clarity. The Relative Strength Index (RSI) on the daily chart sits near 47, reflecting neutral to bearish momentum and suggesting that sellers are regaining control. The MACD histogram remains slightly positive, though the signal line is beginning to flatten, hinting at a potential slowdown in momentum if corrective pressures persist. Volume analysis shows increased participation during the dip to 0.8067, indicating that the move was supported by conviction rather than thin liquidity, a sign that sellers are committed to defending higher levels.

The macroeconomic backdrop adds depth to the technical picture. The U.S. Dollar has benefited from stabilizing growth and expectations around Federal Reserve policy. With inflation showing signs of moderation, markets are increasingly pricing in the possibility of a rate cut later in 2026, but the Fed?s cautious stance has prevented a wholesale bearish shift. Meanwhile, the Swiss franc continues to retain its safe haven appeal, bolstered by Switzerland?s stable economic outlook and relatively lower inflation compared to the U.S. The Swiss National Bank has maintained a cautious stance, intervening selectively to prevent excessive franc strength but allowing gradual appreciation. This divergence in fundamentals has created a tug of war between USD recovery optimism and franc stability, making USD/CHF?s trajectory highly sensitive to shifts in sentiment.

Trading implications are clear. Short term traders may look to capitalize on range bound strategies, buying dips near 0.8067?0.8050 with tight stops while targeting rebounds toward 0.8130. Swing traders may prefer to wait for a confirmed break above 0.8150 to position for a medium term extension toward 0.8200. Conversely, a failure to hold above 0.8050 would shift bias toward bearish retracement, with 0.8000 as the next key battleground.
In conclusion, the USD/CHF low of 0.8067 on 26 June 2026 reflects a market undergoing short term consolidation within a broader bullish trend. Technical indicators, price structure, and macro fundamentals collectively suggest that while corrective pressures are present, the path of least resistance remains higher, with 0.8130?0.8150 serving as the next critical targets for buyers.

#fxopen #forex #forexanalysis

Disclaimer: This analysis represents my own opinion only. It is not to be construed as an opinion, offer, solicitation, recommendation, or financial advice of the Companies operating under the FXOpen brand.

For in-depth analysis, please check ...
#260 - July 02, 2026, 05:33:49 AM

Sponsored

Daily Market Analytics - Forex in Technical_6803a6c52eb12
#261 - Today at 02:07:45 AM

  • Hero Member
  • Posts: 3580
  • Points: 130047
  • Likes Received: 384
  • Reputation: +8/-2
USDJPY Technical Analysis ? 26 JUNE, 2026
USDJPY - USD/JPY recorded a low of 161.53 on 26 June 2026, a level that underscores the yen?s attempt to regain ground against the U.S. Dollar while still operating within a firmly established bullish framework for USD/JPY.
Daily Market Analytics - Forex in Technical_sAp65Fkx_o
 
USD/JPY recorded a low of 161.53 on 26 June 2026, a level that underscores the yen?s attempt to regain ground against the U.S. Dollar while still operating within a firmly established bullish framework for USD/JPY. This low is significant because it represents a corrective pullback from the 161.82 high seen the previous day, reflecting profit taking and short term consolidation rather than a structural reversal. The move to 161.53 illustrates the market?s sensitivity to resistance levels while underscoring the broader macroeconomic divergence driving the pair.

From a technical perspective, the 161.53 low sits at the lower boundary of the short term consolidation zone that has formed between 161.50 and 162.00. The pair remains firmly within a rising channel that has guided price action since late May, with the lower boundary near 160.50 and the upper boundary extending toward 164.00. The inability to sustain momentum above 162.00 reinforced the presence of sellers at higher levels, leading to the corrective dip toward 161.53. This level now serves as immediate support, with any decisive break below it likely to expose the pair to further downside toward 160.50, a zone last tested in early June. On the upside, resistance is clearly defined at 162.00, followed by 164.00, which represents a key barrier to recovery and continuation of the uptrend.

Momentum indicators provide additional clarity. The Relative Strength Index (RSI) on the daily chart sits near 64, reflecting strong bullish momentum but showing signs of cooling as the pair consolidates. This suggests that while buyers remain in control, the market is pausing to absorb recent gains. The MACD histogram remains positive, though the signal line is beginning to flatten, hinting at a potential slowdown in momentum if corrective pressures persist. Volume analysis shows moderate activity during the dip to 161.53, indicating that the move was driven more by profit taking than by aggressive selling, a sign that the broader bullish bias remains intact.

The macroeconomic backdrop adds depth to the technical picture. The U.S. Dollar has benefited from stabilizing growth and expectations around Federal Reserve policy. With inflation showing signs of moderation, markets are increasingly pricing in the possibility of a rate cut later in 2026, but the Fed?s cautious stance has prevented a wholesale bearish shift. Meanwhile, the Japanese yen continues to suffer from the Bank of Japan?s ultra loose monetary policy, which has kept interest rates near zero despite rising global yields. This divergence in monetary policy has widened yield differentials, making the dollar more attractive relative to the yen. Additionally, global risk appetite has diminished the yen?s safe haven appeal, further weakening its position against higher yielding currencies.

Trading implications are clear. Short term traders may look to capitalize on range bound strategies, buying dips near 161.50 with tight stops while targeting rebounds toward 162.00. Swing traders may prefer to wait for a confirmed break above 162.00 to position for a medium term extension toward 164.00. Conversely, a failure to hold above 160.50 would shift bias toward bearish retracement, with 159.50 as the next key battleground.
In conclusion, the USD/JPY low of 161.53 on 26 June 2026 reflects a market undergoing short term consolidation within a broader bullish trend. Technical indicators, price structure, and macro fundamentals collectively suggest that while corrective pressures are present, the path of least resistance remains higher, with 162.00?164.00 serving as the next critical targets for buyers.

#fxopen #forex #forexanalysis

Disclaimer: This analysis represents my own opinion only. It is not to be construed as an opinion, offer, solicitation, recommendation, or financial advice of the Companies operating under the FXOpen brand.

For in-depth analysis, please check ...
#261 - July 02, 2026, 06:06:27 AM

  • Hero Member
  • Posts: 3580
  • Points: 130047
  • Likes Received: 384
  • Reputation: +8/-2
AUDUSD Technical Analysis ? 20 July, 2026
AUDUSD ? The Australian dollar?s advance to 0.7014 against the U.S. dollar represents a critical juncture in the pair?s technical structure
Daily Market Analytics - Forex in Technical_AUDUSDM15

AUDUSD ? High 0.7014 (20 July 2026)
The Australian dollar?s advance to 0.7014 against the U.S. dollar represents a critical juncture in the pair?s technical structure, highlighting both the resilience of short-term bullish momentum and the broader challenges posed by prevailing macroeconomic conditions. This level has emerged as a formidable resistance zone, coinciding with the upper boundary of a medium-term descending channel that has guided price action since late Q2. The inability to decisively clear this threshold underscores the tension between speculative optimism and the underlying strength of the U.S. dollar, which continues to exert gravitational pull on the pair.

Momentum indicators provide a telling narrative. The Relative Strength Index (RSI) has edged toward the 65?70 band, a region often associated with overbought conditions. This suggests that while buyers have managed to push AUDUSD higher, the rally is beginning to lose steam. The Moving Average Convergence Divergence (MACD) histogram has flattened, signalling waning bullish momentum and raising the possibility of a corrective phase. Such technical signals, when aligned with a major resistance level, often precede a retracement as traders reassess risk exposure.

Moving averages further reinforce the significance of this high. The 50-day simple moving average (SMA) has stabilized near 0.6950, acting as immediate support, while the 200-day SMA remains anchored around 0.7100. The proximity of the current high to the longer-term average suggests that AUDUSD is testing a pivotal inflection point. A sustained break above 0.7014 would open the path toward 0.7100, potentially shifting sentiment toward a medium-term bullish reversal. Conversely, rejection at this level would reaffirm the prevailing downtrend, with downside targets clustered around 0.6920 and 0.6850.

Volume analysis adds another layer of caution. The rally into 0.7014 has not been accompanied by a surge in trading activity, a divergence that undermines the credibility of the breakout attempt. Without strong participation, price advances risk becoming unsustainable, leaving the pair vulnerable to sharp reversals if external catalysts?such as shifts in Federal Reserve policy expectations or commodity price fluctuations?turn unfavourable. Given Australia?s reliance on resource exports, any weakness in global demand or renewed strength in the U.S. dollar could accelerate downside pressure.

Fibonacci retracement levels provide additional clarity. The move from the June low near 0.6820 to the July high at 0.7014 places the 38.2% retracement around 0.6945. This level coincides neatly with the 50-day SMA, creating a layered support zone that traders will monitor closely. A break below this zone would confirm bearish resumption, while holding above it could sustain consolidation before another attempt at resistance.

In essence, the high at 0.7014 is less a breakout signal and more a litmus test of AUDUSD?s ability to transition from corrective recovery into genuine trend reversal. The broader narrative remains one of cautious optimism tempered by structural headwinds. While the Australian dollar has benefited from intermittent risk-on sentiment and commodity resilience, the U.S. dollar?s underlying strength?driven by higher yields and safe-haven demand?continues to cap rallies. Until price action decisively clears this barrier with conviction, traders are likely to treat rallies as opportunities to fade, keeping the pair locked within its broader bearish framework.

#fxopen #forex #forexanalysis

Disclaimer: This analysis represents my own opinion only. It is not to be construed as an opinion, offer, solicitation, recommendation, or financial advice of the Companies operating under the FXOpen brand.
#262 - August 01, 2026, 10:27:55 AM

  • Hero Member
  • Posts: 3580
  • Points: 130047
  • Likes Received: 384
  • Reputation: +8/-2
EURCHF Technical Analysis ? 20 JULY, 2026
EURCHF ? The Euro?s climb to 0.9248 against the Swiss franc marks a significant resistance point within the broader technical framework of this pair
Daily Market Analytics - Forex in Technical_EURCHFM15

EURCHF ? High 0.9248 (20 July 2026)
The euro?s climb to 0.9248 against the Swiss franc marks a significant resistance point within the broader technical framework of this pair, underscoring the delicate balance between euro strength and the franc?s traditional safe-haven appeal. This high is particularly notable as it coincides with the upper boundary of a consolidation phase that has defined EURCHF?s trajectory over the past several weeks. The inability to decisively break above this level highlights the market?s hesitation, reflecting both technical constraints and macroeconomic uncertainties tied to European monetary policy and Swiss stability.

Momentum indicators reveal a mixed picture. The Relative Strength Index (RSI) has approached the 60?65 range, suggesting moderate bullish momentum but not yet signalling overbought conditions. This implies that while buyers have managed to push the pair higher, conviction remains limited. The Moving Average Convergence Divergence (MACD) line has crossed above its signal line, hinting at short-term bullish continuation, yet the histogram?s modest expansion suggests that momentum is fragile and vulnerable to reversal should external catalysts shift.

Moving averages provide further context. The 50-day simple moving average (SMA) has risen toward 0.9180, offering immediate support, while the 200-day SMA lingers near 0.9300. The current high at 0.9248 sits between these two averages, creating a technical inflection zone. A sustained break above 0.9248 would likely pave the way toward 0.9300, aligning with the longer-term average and potentially signalling a medium-term bullish reversal. Conversely, rejection at this level would reinforce the consolidation narrative, with downside targets clustered around 0.9180 and deeper retracement potential toward 0.9120.

Volume dynamics add a layer of caution. The rally into 0.9248 has not been accompanied by a surge in participation, suggesting that institutional players remain hesitant to commit fully to the upside. This divergence between price and volume undermines the sustainability of the move, leaving the pair vulnerable to sharp corrections if risk sentiment deteriorates or if the Swiss franc regains safe-haven demand amid geopolitical or economic shocks.
Fibonacci retracement analysis further refines the outlook. The move from the June low near 0.9100 to the July high at 0.9248 places the 38.2% retracement around 0.9185, which coincides with the 50-day SMA. This confluence creates a layered support zone that traders will monitor closely. A break below this zone would confirm bearish resumption, while holding above it could sustain consolidation before another attempt at resistance.

The broader narrative remains one of cautious equilibrium. The euro has benefited from intermittent optimism surrounding European growth prospects and policy stability, yet the Swiss franc?s enduring appeal as a safe-haven currency continues to cap rallies. The high at 0.9248 is therefore less a breakout signal and more a test of whether EURCHF can transition from range-bound consolidation into a sustained bullish trend. Until price action decisively clears this barrier with conviction, traders are likely to treat rallies as opportunities to fade, keeping the pair locked within its broader neutral-to-bearish framework.

#fxopen #forex #forexanalysis

Disclaimer: This analysis represents my own opinion only. It is not to be construed as an opinion, offer, solicitation, recommendation, or financial advice of the Companies operating under the FXOpen brand.
#263 - August 01, 2026, 10:30:19 AM

  • Hero Member
  • Posts: 3580
  • Points: 130047
  • Likes Received: 384
  • Reputation: +8/-2
EURJPY Technical Analysis ? 20 JULY, 2026
EURJPY ? The Decline to 185.34 in EURJPY represents a crucial technical development, as the pair has retreated to a level that aligns with both structural support and broader trend dynamics
Daily Market Analytics - Forex in Technical_EURJPYM15

EURJPY ? Low 185.34 (20 July 2026)
The decline to 185.34 in EURJPY represents a crucial technical development, as the pair has retreated to a level that aligns with both structural support and broader trend dynamics. This low is significant because it marks the lower boundary of a medium-term consolidation range that has contained price action since late Q2. The inability to sustain higher levels reflects renewed demand for the Japanese yen, driven by safe-haven flows and yield differentials, while the euro?s momentum has faltered amid mixed economic signals from the Eurozone.

Momentum indicators highlight the fragility of the current move. The Relative Strength Index (RSI) has dipped toward the 40?45 band, suggesting bearish momentum but not yet oversold conditions. This positioning indicates that while sellers are in control, there is still room for further downside before exhaustion sets in. The Moving Average Convergence Divergence (MACD) histogram has turned negative, reinforcing the bearish bias and signalling that momentum favours continued yen strength in the near term.

Moving averages provide additional context. The 50-day simple moving average (SMA) has rolled over near 187.20, now acting as immediate resistance, while the 200-day SMA remains anchored around 183.50. The current low at 185.34 sits between these averages, creating a technical inflection zone. A sustained break below 185.34 would likely expose the 183.50 level, aligning with the longer-term average and potentially confirming a medium-term bearish reversal. Conversely, holding above this low could sustain consolidation, with rebound potential toward 187.20 if euro sentiment stabilizes.

Volume dynamics suggest caution. The decline into 185.34 has been accompanied by increased participation, which validates the bearish move and underscores the conviction behind yen buying. This divergence between price and volume strengthens the case for further downside, particularly if risk sentiment deteriorates or if Japanese yields remain stable relative to European counterparts.

Fibonacci retracement levels refine the outlook. The move from the June high near 190.80 to the July low at 185.34 places the 38.2% retracement around 187.40. This level coincides with the 50-day SMA, creating a layered resistance zone that traders will monitor closely. A break above this zone would signal corrective recovery, while rejection would confirm bearish continuation.

The broader narrative remains one of cautious bearishness. The euro has struggled to maintain momentum amid uneven growth prospects and policy uncertainty, while the yen continues to benefit from its safe-haven appeal and relative stability. The low at 185.34 is therefore less a signal of exhaustion and more a test of whether EURJPY can transition from consolidation into a sustained bearish trend. Until price action decisively rebounds with conviction, traders are likely to treat rallies as corrective in nature, keeping the pair biased toward further downside within its broader structural framework.

#fxopen #forex #forexanalysis

Disclaimer: This analysis represents my own opinion only. It is not to be construed as an opinion, offer, solicitation, recommendation, or financial advice of the Companies operating under the FXOpen brand.
#264 - August 01, 2026, 10:33:24 AM

  • Hero Member
  • Posts: 3580
  • Points: 130047
  • Likes Received: 384
  • Reputation: +8/-2
EURUSD Technical Analysis ? 20 JULY, 2026
EURUSD ? The Euro?s decline to 1.1402 against the U.S. dollar marks a critical technical low, underscoring the dominance of bearish sentiment
Daily Market Analytics - Forex in Technical_EURUSDM15

EURUSD ? Low 1.1402 (20 July 2026)
The euro?s decline to 1.1402 against the U.S. dollar marks a critical technical low, underscoring the dominance of bearish sentiment and the resilience of dollar strength in the current market environment. This level represents not only a psychological threshold but also a structural support zone that has historically influenced trader positioning. The inability of EURUSD to sustain higher ground reflects the combined impact of Eurozone economic uncertainty and the persistent appeal of the U.S. dollar as a safe-haven asset amid global volatility.

Momentum indicators paint a distinctly bearish picture. The Relative Strength Index (RSI) has slipped toward the 35?40 range, signalling that selling pressure remains pronounced, though not yet in extreme oversold territory. This suggests room for further downside before exhaustion sets in. The Moving Average Convergence Divergence (MACD) histogram has deepened into negative territory, reinforcing the bearish bias and confirming that momentum favours continued dollar strength in the near term.

Moving averages provide additional clarity. The 50-day simple moving average (SMA) has rolled over near 1.1550, now acting as immediate resistance, while the 200-day SMA remains anchored around 1.1650. The current low at 1.1402 sits well below both averages, highlighting the extent of bearish control. A sustained break below 1.1402 would likely expose deeper support near 1.1320, while any corrective rebound would face stiff resistance at 1.1550, limiting upside potential unless euro sentiment improves significantly.

Volume dynamics validate the move. The decline into 1.1402 has been accompanied by heightened participation, suggesting strong conviction behind the bearish trend. This alignment between price and volume strengthens the case for further downside, particularly if macro drivers such as Federal Reserve policy expectations or Eurozone growth concerns continue to favour the dollar.

Fibonacci retracement analysis adds precision to the outlook. The move from the June high near 1.1720 to the July low at 1.1402 places the 38.2% retracement around 1.1520. This level coincides with the 50-day SMA, creating a layered resistance zone that traders will monitor closely. A break above this zone would signal corrective recovery, while rejection would confirm bearish continuation.

The broader narrative remains one of sustained dollar dominance. The euro has struggled to maintain momentum amid uneven growth prospects, inflationary pressures, and policy uncertainty within the Eurozone. Meanwhile, the U.S. dollar continues to benefit from higher yields, safe-haven demand, and relative economic resilience. The low at 1.1402 is therefore less a signal of exhaustion and more a test of whether EURUSD can stabilize or whether the pair is poised for deeper declines. Until price action decisively rebounds with conviction, traders are likely to treat any rallies as corrective in nature, keeping the pair biased toward further downside within its broader structural framework.

#fxopen #forex #forexanalysis

Disclaimer: This analysis represents my own opinion only. It is not to be construed as an opinion, offer, solicitation, recommendation, or financial advice of the Companies operating under the FXOpen brand.
#265 - August 01, 2026, 10:48:31 AM

  • Hero Member
  • Posts: 3580
  • Points: 130047
  • Likes Received: 384
  • Reputation: +8/-2
GBPJPY Technical Analysis ? 20 JULY, 2026
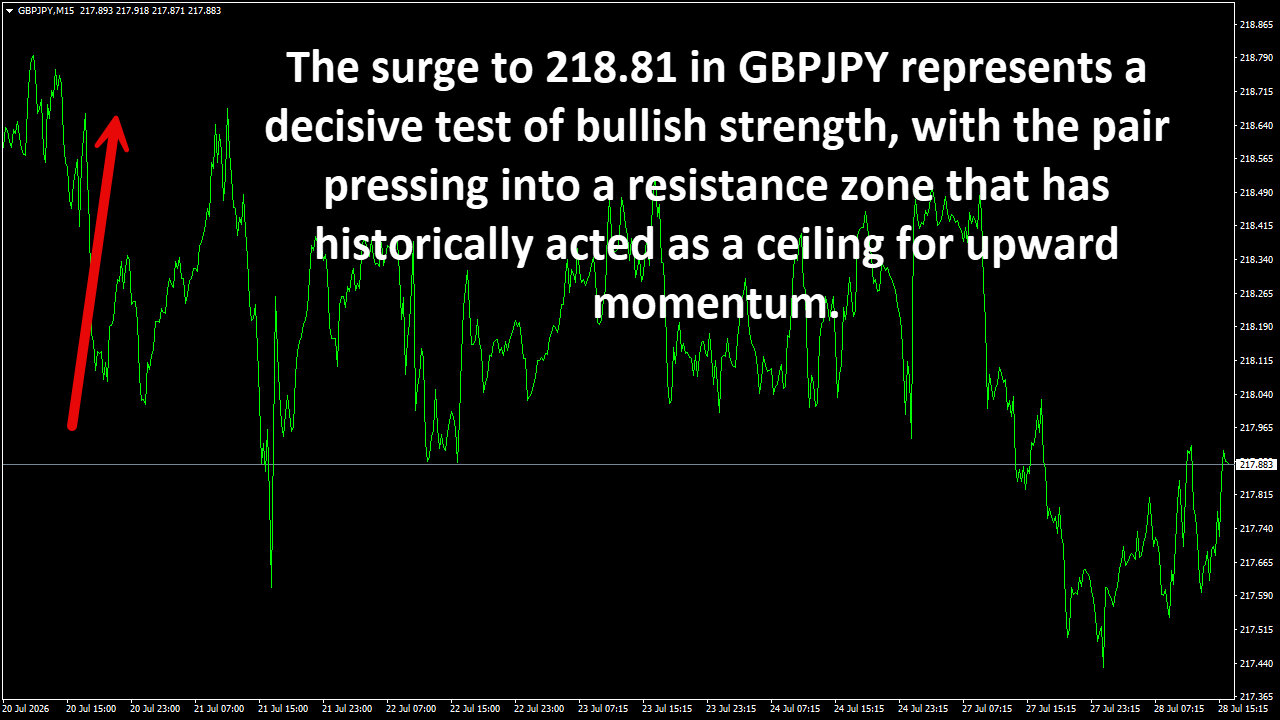
GBPJPY ? The surge to 218.81 in GBPJPY represents a decisive test of bullish strength, with the pair pressing into a resistance zone that has historically acted as a ceiling for upward momentum.
Daily Market Analytics - Forex in Technical_GBPJPYM15

GBPJPY ? High 218.81 (20 July 2026)
The surge to 218.81 in GBPJPY represents a decisive test of bullish strength, with the pair pressing into a resistance zone that has historically acted as a ceiling for upward momentum. This high is particularly significant because it reflects both sterling resilience and yen weakness, a dynamic often driven by divergent monetary policies and risk sentiment. The level at 218.81 is not just a technical barrier but a psychological threshold, where traders must decide whether the rally is sustainable or merely an overextension.

Momentum indicators provide important context. The Relative Strength Index (RSI) has climbed into the 70?75 band, firmly in overbought territory. This suggests that while buyers have dominated, the rally is stretched and vulnerable to corrective pullback. The Moving Average Convergence Divergence (MACD) histogram remains positive, but its slope has begun to flatten, signalling waning bullish momentum. Such conditions often precede consolidation or retracement, particularly when price action approaches a major resistance level.

Moving averages reinforce the technical picture. The 50-day simple moving average (SMA) has advanced toward 214.50, offering immediate support, while the 200-day SMA lingers near 210.00. The current high at 218.81 sits well above both averages, highlighting the strength of the recent rally but also raising questions about sustainability. A sustained break above 218.81 would open the path toward 220.50, potentially confirming a medium-term bullish continuation. Conversely, rejection at this level would likely trigger a retracement toward 214.50, with deeper downside potential toward 210.00 if momentum fades.

Volume dynamics suggest caution. The rally into 218.81 has been accompanied by moderate participation, not the kind of surge that typically validates a breakout. This divergence between price and volume undermines the credibility of the move, leaving the pair vulnerable to reversal if external catalysts?such as shifts in global risk sentiment or yen demand?turn unfavourable.

Fibonacci retracement analysis adds precision. The move from the June low near 208.20 to the July high at 218.81 places the 38.2% retracement around 214.80. This level coincides neatly with the 50-day SMA, creating a layered support zone that traders will monitor closely. A break below this zone would confirm bearish resumption, while holding above it could sustain consolidation before another attempt at resistance.

The broader narrative remains one of sterling strength tempered by structural risks. The pound has benefited from optimism surrounding UK growth prospects and policy stability, while the yen continues to weaken under the weight of accommodative monetary policy and global risk-on sentiment. Yet the high at 218.81 is less a breakout signal and more a litmus test of whether GBPJPY can transition from short-term exuberance into sustained bullish trend. Until price action decisively clears this barrier with conviction, traders are likely to treat rallies as opportunities to fade, keeping the pair vulnerable to corrective pullbacks within its broader structural framework.

For traders, the implications are clear. Short-term participants may look to exploit momentum by targeting the 216.00?217.00 resistance zone, while maintaining tight risk controls below 213.00. Swing traders may interpret the 215.31 high as a potential breakout precursor, positioning for a medium-term move toward 220.00, contingent on sustained closes above 216.00. Conversely, a rejection at current levels would signal a period of consolidation, with 210.80 acting as the key battleground for directional bias.

In conclusion, the GBP/JPY high of 215.31 on 02 June 2026 represents a pivotal test of bullish resilience near multi-decade highs. Technical indicators, price structure, and macro fundamentals collectively suggest that the pair remains poised for further upside, provided it can decisively clear the 216.00 resistance zone. Until then, traders should remain alert to potential consolidation phases while respecting the dominant bullish trend.

#fxopen #forex #forexanalysis

Disclaimer: This analysis represents my own opinion only. It is not to be construed as an opinion, offer, solicitation, recommendation, or financial advice of the Companies operating under the FXOpen brand.
#266 - August 01, 2026, 10:51:27 AM

  • Hero Member
  • Posts: 3580
  • Points: 130047
  • Likes Received: 384
  • Reputation: +8/-2
GBPUSD Technical Analysis ? 20 JULY, 2026
GBPUSD ? The advance to 1.3480 in GBPUSD marks a pivotal resistance point, underscoring sterling?s attempt to assert strength against the U.S. dollar while simultaneously testing the durability of its bullish momentum.
Daily Market Analytics - Forex in Technical_GBPUSDM15

GBPUSD ? High 1.3480 (20 July 2026)
The advance to 1.3480 in GBPUSD marks a pivotal resistance point, underscoring sterling?s attempt to assert strength against the U.S. dollar while simultaneously testing the durability of its bullish momentum. This high is particularly important because it coincides with the upper boundary of a medium-term ascending channel that has guided price action since late Q2. The inability to decisively break above this level highlights the tension between optimism surrounding UK economic prospects and the persistent resilience of the U.S. dollar, which continues to benefit from higher yields and safe-haven demand.

Momentum indicators provide a nuanced perspective. The Relative Strength Index (RSI) has climbed into the 65?70 band, suggesting strong bullish momentum but also warning of potential overbought conditions. The Moving Average Convergence Divergence (MACD) histogram remains positive, yet its slope has begun to flatten, signalling that while buyers remain in control, momentum is beginning to wane. This combination often precedes consolidation, particularly when price approaches a major resistance level.

Moving averages reinforce the technical significance of this high. The 50-day simple moving average (SMA) has advanced toward 1.3350, offering immediate support, while the 200-day SMA lingers near 1.3550. The current high at 1.3480 sits between these averages, creating a technical inflection zone. A sustained break above 1.3480 would likely pave the way toward 1.3550, aligning with the longer-term average and potentially confirming a medium-term bullish continuation. Conversely, rejection at this level would reinforce the consolidation narrative, with downside targets clustered around 1.3350 and deeper retracement potential toward 1.3250.

Volume dynamics suggest caution. The rally into 1.3480 has not been accompanied by a surge in participation, undermining the credibility of the breakout attempt. This divergence between price and volume hints at a fragile rally, one susceptible to reversal if external catalysts?such as shifts in Federal Reserve policy expectations or global risk sentiment?turn unfavourable.

Fibonacci retracement analysis adds precision. The move from the June low near 1.3200 to the July high at 1.3480 places the 38.2% retracement around 1.3370. This level coincides neatly with the 50-day SMA, creating a layered support zone that traders will monitor closely. A break below this zone would confirm bearish resumption, while holding above it could sustain consolidation before another attempt at resistance.

The broader narrative remains one of cautious optimism tempered by structural headwinds. Sterling has benefited from intermittent optimism surrounding UK growth prospects and policy stability, while the U.S. dollar continues to exert pressure through its yield advantage and safe-haven appeal. The high at 1.3480 is therefore less a breakout signal and more a litmus test of whether GBPUSD can transition from corrective recovery into a genuine trend reversal. Until price action decisively clears this barrier with conviction, traders are likely to treat rallies as opportunities to fade, keeping the pair locked within its broader neutral-to-bearish framework.

#fxopen #forex #forexanalysis

Disclaimer: This analysis represents my own opinion only. It is not to be construed as an opinion, offer, solicitation, recommendation, or financial advice of the Companies operating under the FXOpen brand.
#267 - August 01, 2026, 10:53:52 AM

  • Hero Member
  • Posts: 3580
  • Points: 130047
  • Likes Received: 384
  • Reputation: +8/-2
NZDUSD Technical Analysis ? 20 JULY, 2026
NZDUSD ? The New Zealand dollar?s rise to 0.5863 against the U.S. dollar marks a critical resistance point, reflecting both the fragility of kiwi strength and the persistent dominance of the U.S. dollar in global markets.
Daily Market Analytics - Forex in Technical_NZDUSDM15

NZDUSD ? High 0.5863 (20 July 2026)
The New Zealand dollar?s rise to 0.5863 against the U.S. dollar marks a critical resistance point, reflecting both the fragility of kiwi strength and the persistent dominance of the U.S. dollar in global markets. This high is particularly significant because it coincides with the upper boundary of a corrective recovery phase that has unfolded since early July. The inability to decisively break above this level highlights the tension between short-term optimism surrounding New Zealand?s economic outlook and the structural headwinds posed by dollar resilience.

Momentum indicators provide a telling narrative. The Relative Strength Index (RSI) has edged into the 60?65 range, suggesting moderate bullish momentum but not yet signalling overbought conditions. This positioning implies that while buyers have managed to push NZDUSD higher, conviction remains limited. The Moving Average Convergence Divergence (MACD) histogram has turned positive, hinting at short-term bullish continuation, yet its modest slope suggests momentum is fragile and vulnerable to reversal should external catalysts shift.

Moving averages reinforce the technical significance of this high. The 50-day simple moving average (SMA) has advanced toward 0.5800, offering immediate support, while the 200-day SMA lingers near 0.5950. The current high at 0.5863 sits between these averages, creating a technical inflection zone. A sustained break above 0.5863 would likely pave the way toward 0.5950, aligning with the longer-term average and potentially confirming a medium-term bullish reversal. Conversely, rejection at this level would reinforce the corrective narrative, with downside targets clustered around 0.5800 and deeper retracement potential toward 0.5720.

Volume dynamics suggest caution. The rally into 0.5863 has not been accompanied by a surge in participation, undermining the credibility of the breakout attempt. This divergence between price and volume hints at a fragile rally, one susceptible to reversal if external catalysts?such as shifts in Federal Reserve policy expectations or global risk sentiment?turn unfavourable.

Fibonacci retracement analysis adds precision. The move from the June low near 0.5700 to the July high at 0.5863 places the 38.2% retracement around 0.5805. This level coincides neatly with the 50-day SMA, creating a layered support zone that traders will monitor closely. A break below this zone would confirm bearish resumption, while holding above it could sustain consolidation before another attempt at resistance.

The broader narrative remains one of cautious equilibrium. The New Zealand dollar has benefited from intermittent optimism surrounding domestic growth prospects and commodity resilience, yet the U.S. dollar?s enduring appeal as a safe-haven currency continues to cap rallies. The high at 0.5863 is therefore less a breakout signal and more a test of whether NZDUSD can transition from corrective recovery into a sustained bullish trend. Until price action decisively clears this barrier with conviction, traders are likely to treat rallies as opportunities to fade, keeping the pair locked within its broader neutral-to-bearish framework.

#fxopen #forex #forexanalysis

Disclaimer: This analysis represents my own opinion only. It is not to be construed as an opinion, offer, solicitation, recommendation, or financial advice of the Companies operating under the FXOpen brand.
#268 - August 01, 2026, 10:58:26 AM

  • Hero Member
  • Posts: 3580
  • Points: 130047
  • Likes Received: 384
  • Reputation: +8/-2
USDCAD Technical Analysis ? 20 JULY, 2026
USDCAD ? The Decline to 1.4003 in USDCAD represents a critical technical low, underscoring the strength of the Canadian dollar relative to the U.S. dollar
Daily Market Analytics - Forex in Technical_USDCADM15

USDCAD ? Low 1.4003 (20 July 2026)
The decline to 1.4003 in USDCAD represents a critical technical low, underscoring the strength of the Canadian dollar relative to the U.S. dollar and highlighting the broader interplay between commodity-linked currencies and global monetary dynamics. This level is particularly significant because it coincides with a structural support zone that has historically influenced trader positioning. The inability of USDCAD to sustain higher ground reflects renewed demand for the Canadian dollar, often tied to oil price resilience, while the U.S. dollar?s momentum has softened amid shifting expectations around monetary policy.

Momentum indicators provide a clear bearish narrative. The Relative Strength Index (RSI) has slipped into the 35?40 range, signalling strong selling pressure but not yet extreme oversold conditions. This suggests that while sellers remain firmly in control, there is still room for further downside before exhaustion sets in. The Moving Average Convergence Divergence (MACD) histogram has deepened into negative territory, reinforcing the bearish bias and confirming that momentum favours continued Canadian dollar strength in the near term.

Moving averages add further context. The 50-day simple moving average (SMA) has rolled over near 1.4120, now acting as immediate resistance, while the 200-day SMA remains anchored around 1.4250. The current low at 1.4003 sits well below both averages, highlighting the extent of bearish control. A sustained break below 1.4003 would likely expose deeper support near 1.3920, while any corrective rebound would face stiff resistance at 1.4120, limiting upside potential unless U.S. dollar sentiment improves significantly.

Volume dynamics validate the move. The decline into 1.4003 has been accompanied by heightened participation, suggesting strong conviction behind the bearish trend. This alignment between price and volume strengthens the case for further downside, particularly if oil prices remain firm or if the Federal Reserve signals a more dovish stance relative to the Bank of Canada.

Fibonacci retracement analysis refines the outlook. The move from the June high near 1.4320 to the July low at 1.4003 places the 38.2% retracement around 1.4125. This level coincides neatly with the 50-day SMA, creating a layered resistance zone that traders will monitor closely. A break above this zone would signal corrective recovery, while rejection would confirm bearish continuation.

The broader narrative remains one of Canadian dollar resilience tempered by global uncertainties. The Loonie has benefited from commodity-linked strength and relative policy stability, while the U.S. dollar has struggled to maintain momentum amid shifting yield dynamics and safe-haven flows. The low at 1.4003 is therefore less a signal of exhaustion and more a test of whether USDCAD can stabilize or whether the pair is poised for deeper declines. Until price action decisively rebounds with conviction, traders are likely to treat any rallies as corrective in nature, keeping the pair biased toward further downside within its broader structural framework.

#fxopen #forex #forexanalysis

Disclaimer: This analysis represents my own opinion only. It is not to be construed as an opinion, offer, solicitation, recommendation, or financial advice of the Companies operating under the FXOpen brand.
#269 - August 01, 2026, 11:01:05 AM

  • Hero Member
  • Posts: 3580
  • Points: 130047
  • Likes Received: 384
  • Reputation: +8/-2
USDCHF Technical Analysis ? 20 JULY, 2026
USDCHF ? The drop to 0.8062 in USDCHF marks a decisive technical low, underscoring the strength of the Swiss franc and the vulnerability of the U.S. dollar in the current market environment
Daily Market Analytics - Forex in Technical_USDCHFM15

USDCHF ? Low 0.8062 (20 July 2026)
The drop to 0.8062 in USDCHF marks a decisive technical low, underscoring the strength of the Swiss franc and the vulnerability of the U.S. dollar in the current market environment. This level is particularly significant because it represents a multi-month support zone, one that has historically acted as a pivot for price stabilization. The inability of USDCHF to sustain higher ground reflects renewed demand for the franc?s safe-haven qualities, while the dollar?s momentum has softened amid shifting expectations around global monetary policy and risk sentiment.

Momentum indicators highlight the depth of bearish pressure. The Relative Strength Index (RSI) has slipped into the 30?35 band, signalling strong selling momentum and approaching oversold conditions. This suggests that while sellers remain firmly in control, the pair may be nearing exhaustion, raising the possibility of a corrective rebound. The Moving Average Convergence Divergence (MACD) histogram has deepened into negative territory, reinforcing the bearish bias and confirming that momentum favours continued franc strength in the near term.

Moving averages provide further clarity. The 50-day simple moving average (SMA) has rolled over near 0.8200, now acting as immediate resistance, while the 200-day SMA remains anchored around 0.8350. The current low at 0.8062 sits well below both averages, highlighting the extent of bearish control. A sustained break below 0.8062 would likely expose deeper support near 0.7980, while any corrective rebound would face stiff resistance at 0.8200, limiting upside potential unless U.S. dollar sentiment improves significantly.

Volume dynamics validate the move. The decline into 0.8062 has been accompanied by heightened participation, suggesting strong conviction behind the bearish trend. This alignment between price and volume strengthens the case for further downside, particularly if global risk sentiment deteriorates or if Swiss yields remain stable relative to U.S. counterparts.

Fibonacci retracement analysis refines the outlook. The move from the June high near 0.8420 to the July low at 0.8062 places the 38.2% retracement around 0.8190. This level coincides neatly with the 50-day SMA, creating a layered resistance zone that traders will monitor closely. A break above this zone would signal corrective recovery, while rejection would confirm bearish continuation.

The broader narrative remains one of Swiss franc resilience tempered by global uncertainties. The franc has benefited from its enduring appeal as a safe-haven currency, while the U.S. dollar has struggled to maintain momentum amid shifting yield dynamics and policy expectations. The low at 0.8062 is therefore less a signal of exhaustion and more a test of whether USDCHF can stabilize or whether the pair is poised for deeper declines. Until price action decisively rebounds with conviction, traders are likely to treat any rallies as corrective in nature, keeping the pair biased toward further downside within its broader structural framework.

#fxopen #forex #forexanalysis

Disclaimer: This analysis represents my own opinion only. It is not to be construed as an opinion, offer, solicitation, recommendation, or financial advice of the Companies operating under the FXOpen brand.

#270 - August 01, 2026, 11:03:29 AM

Members:

0 Members and 2 Guests are viewing this topic.


Daily Market Analytics - Forex in Technical_67f8365a73a8c