Forex Zone - Forex Forum

Classical Technical Analysis Using Dow Theory

Discussion started on Technical

  • Full Member
  • Posts: 104
  • Points: 0
  • Likes Received: 4
  • Reputation: +0/-0
The development of the world of investment in the financial markets and derivatives lately is increasingly widespread, both in the stock market, bonds, stock indices, commodity futures, and not to be left behind in the foreign exchange market and others. Along with the development of investors and traders in this sector, the ways and systems that are used in their efforts to gain profits are growing, both fundamentally and technically. Among the many choices available, on this occasion, I tried to refresh the Classical Technical Analysis Using the Dow Theory.

This discussion is solely trying to rejuvenate one of the classical analysis techniques that has developed since more than a century ago, in addition as an effort to present a choice of the many system choices and trading techniques available, especially for Indo forum visitors. mt5. My hope will be of benefit to us all.

Although the discussion on trit mostly uses Dow theory, however, there will be a few additions. The following are the topics of discussion:

1. Overview of Dow Theory
2. Dow Theory Performance
3. Criticism of Dow Theory
4. Trend (Price Trend)
a. Trend Phase Phase Phase
b. Price Movement Has Reflected Everything
c. Linkage between Price Movements between Sectors
5. Relationship between Volume and Trend
6. Analysis of the Peak and Valley in the Trend
a. Trend Increases Vs Down Trend
b. Sustainability Trend and Reversal
c. Support and resistance
d. Buy Entry and Sell Entry
e. Take Profit and Stop Loss Targets
I am sure that many of those who visit here have already understood and applied Dow theory as an analytical technique in trading, therefore your suggestions and corrections will add to the benefits and goodness of this trit.


Linkback: https://www.forex.zone/technical/11/classical-technical-analysis-using-dow-theory/1649/
#1 - February 23, 2019, 12:06:00 PM

  • Full Member
  • Posts: 110
  • Points: 0
  • Likes Received: 8
  • Reputation: +0/-0
The development of the world of investment in the financial markets and derivatives lately is increasingly widespread, both in the stock market, bonds, stock indices, commodity futures, and not to be left behind in the foreign exchange market and others. Along with the development of investors and traders in this sector, the ways and systems that are used in their efforts to gain profits are growing, both fundamentally and technically. Among the many choices available, on this occasion, I tried to refresh the Classical Technical Analysis Using the Dow Theory.

This discussion is solely trying to rejuvenate one of the classical analysis techniques that has developed since more than a century ago, in addition as an effort to present a choice of the many system choices and trading techniques available, especially for Indo forum visitors. mt5. My hope will be of benefit to us all.

Although the discussion on trit mostly uses Dow theory, however, there will be a few additions. The following are the topics of discussion:

1. Overview of Dow Theory
2. Dow Theory Performance
3. Criticism of Dow Theory
4. Trend (Price Trend)
a. Trend Phase Phase Phase
b. Price Movement Has Reflected Everything
c. Linkage between Price Movements between Sectors
5. Relationship between Volume and Trend
6. Analysis of the Peak and Valley in the Trend
a. Trend Increases Vs Down Trend
b. Sustainability Trend and Reversal
c. Support and resistance
d. Buy Entry and Sell Entry
e. Take Profit and Stop Loss Targets
I am sure that many of those who visit here have already understood and applied Dow theory as an analytical technique in trading, therefore your suggestions and corrections will add to the benefits and goodness of this trit.
Hi Mr Mohammad Rendy
This is what I've been waiting for . I'll be here to know what is Dow teory 
#2 - February 23, 2019, 12:11:27 PM

  • Full Member
  • Posts: 104
  • Points: 0
  • Likes Received: 4
  • Reputation: +0/-0
Hi Mr Mohammad Rendy
This is what I've been waiting for . I'll be here to know what is Dow teory
From the title, it should be concluded that there is a difference between the system anomaly on the next side which is a technical and fundamental combination with this Classic Technical Analysis which is only technical.

Please, visitors, to be patient first if you want to ask questions, at least until the topic is completed, but if you want to comment please. And in the initial initial topic this was only informative about the Dow Theory. Again, please be patient, so that the discussion will be structured.
#3 - February 23, 2019, 12:13:11 PM

  • Full Member
  • Posts: 104
  • Points: 0
  • Likes Received: 4
  • Reputation: +0/-0
A GLANCE ABOUT DOW THEORY

Dow Theory is the basic theory of technical analysis that was first published by Charles H. Dow (1851-1902) in 255 Wall Street Journal, Dow was a journalist and editor of Wall Street Jornal and founder of Dow Jones and Company. Dow's first research was conducted by dividing shares on Wall Street into 2 groups, namely the Industrial Index and the Transportation Index. He said that the development of the automated manufacturing industry would also be followed by the development of the transportation industry, because factories needed transportation to distribute their products.

Departing from the assumption that if the profits in the transportation industry increase then indirectly it also shows that the production of the manufacturing industry and demand from consumers also increases which in turn can drive the growth of profits of each company. Globally this can be used to measure the level of the economy of a country.

After Dow died there were several people who had a role in developing Dow Theory based on the writing written by Dow in the Wall Street Journal, including William P. Hamilton, Robert Rhea and E. George Schaefer.

Basic Dow Theory
1. The market has three movements
2. The trend has three stages
3. The stock market has absorbed all the news
4. The average stock market must confirm each other
5. The trend must be confirmed by volume
6. The trend is assumed to be valid until it gives a definite signal

The points above are used as a basis in technical analysis. These rules were stated by Dow and then refined by his successors.
#4 - February 23, 2019, 12:14:42 PM

  • Full Member
  • Posts: 104
  • Points: 0
  • Likes Received: 4
  • Reputation: +0/-0
PERFORMANCE OF DOW THEORY

Some research conducted shows that Technical Analysis can be used as one method to build a portfolio using market timing. The simple research conducted by Norman Fosbeck shows that "market timing" is better at generating profits compared to Buy & Hold. The simple problem is that we must really master the technique.

At maanagementfile.com, Arman Boy Manullang told the success story of his friend who invested in the capital market by relying solely on trend analysis from Dow theory as follows, "A friend of mine during college bought shares of PT Bumi Resources Tbk (BUMI) when the price was corrected to the level IDR 400. Then he sold the shares of BUMI at a price of IDR 3000 around September 2009. One type of stock held increased to 650% in a period of less than a year. Incredible is not it? Though only relying on simple analysis and a little courage to went into BUMI's stock when it experienced a very strong selling pressure. The rest, he just patiently waited until he saw a reversal signal. "

Following are the results of Norman Fosbeck's research conducted from 1964-1984

Spoiler: Show


Other research conducted by Jacquiline Doherty (The Truth About Timing)
and published in Barrons (November 5,2001)

Spoiler: Show


Then research by Martin Pring using the Dow Theory method

- By investing $ 44 in 1977 and following all buy and sell signals from the Dow theory, in 198 produced a profit of $ 18,000

-While if you invest $ 44 and hold your portfolio, then in 1981 it only made a profit of $ 960.
#5 - February 23, 2019, 12:15:43 PM

  • Full Member
  • Posts: 104
  • Points: 0
  • Likes Received: 4
  • Reputation: +0/-0
KRTIK ON DOW THEORY

Dow's theory is not free from criticism, as a theory there are weaknesses that accompany its strengths. Critics of Dow Theory that should not be ignored are that in every trending market movement, on average if we use this technique we have missed nearly 20% of market movements. Indeed, in recent cases an optimization method has been developed in order to minimize the lag of the movement. One of them is done by reducing the time frame.

In the development of the next Dow theory began to emerge the Elliot Wave Theory which divides the trend into three parts, namely wave 1.3, and 5 Elliot Wave trying to eliminate weaknesses from Dow Theory. In addition, to be successful in using this theory is knowing your own investment horizon. If our target is for a rather long time, we can see the major trends that occur in these stocks. But if our target is daily, the trend we have to look at is a short swing. Of course consistency and patience are also needed to wait until the trend provides clear direction.

#6 - February 23, 2019, 12:17:29 PM

  • Full Member
  • Posts: 104
  • Points: 0
  • Likes Received: 4
  • Reputation: +0/-0
4. Trend (Price Trend)

a. Trend Phase Phase Phase

Market trends have 3 phases, namely:
• Accumulation is a stage where investors who are "clever" or already have information in advance, make a purchase or sale of shares slowly. At this stage, the stock price tends not to change (sideways trend) because these investors are a minority so that they are unable to move the market.

• The second phase is where other investors start capturing and knowing investor actions in the first phase. Finally the market follows the actions of the first investor to buy or release shares. At this stage, there is a very drastic price change because almost all investors have taken the same action. This phase continues to trend followers and speculators have controlled stock price movements.

• The third phase is where investors first start distributing ownership to the market. Investors start selling or buying shares purchased at the beginning, before the market makes adjustments or corrections to prices. Trend followers who are late in releasing their shares will usually suffer loss.
#7 - February 23, 2019, 12:18:22 PM

  • Full Member
  • Posts: 110
  • Points: 0
  • Likes Received: 8
  • Reputation: +0/-0
From the title, it should be concluded that there is a difference between the system anomaly on the next side which is a technical and fundamental combination with this Classic Technical Analysis which is only technical.

Please, visitors, to be patient first if you want to ask questions, at least until the topic is completed, but if you want to comment please. And in the initial initial topic this was only informative about the Dow Theory. Again, please be patient, so that the discussion will be structured.
OK Mr rendy , I stay tune to get your update about Dow theory.hope it will be soon
#8 - February 23, 2019, 12:19:39 PM

  • Full Member
  • Posts: 104
  • Points: 0
  • Likes Received: 4
  • Reputation: +0/-0
Demikian pula jika diukur dalam kerangka waktu, tiga tipe tren, masing-masing 

1. Major Trend: Merupakan trend jangka panjang dari pergerakan market, biasanya ditentukan dalam kurun waktu minimal 1 tahun

Quote
Spoiler title=SpoilerSpoiler:
Classical Technical Analysis Using Dow Theory in Technical_proxy


2. Medium trend: Merupakan kecenderungan pergerakan harga untuk kerangka waktu jangka menengah biasanya antara 2 minggu sampai 3 bulan dan merupakan gerak koreksi dari major trend (tren utama)

Quote
Spoiler title=SpoilerSpoiler:
Classical Technical Analysis Using Dow Theory in Technical_proxy


3. Minor trend: Pergerakan harga dalam kurun waktu pendek, biasanya dalam kurun daily dan sebagai gerak koreksi dari medium tren

Quote
Spoiler title=SpoilerSpoiler:
Classical Technical Analysis Using Dow Theory in Technical_proxy

#9 - February 23, 2019, 12:21:15 PM

  • Full Member
  • Posts: 104
  • Points: 0
  • Likes Received: 4
  • Reputation: +0/-0
b. Price Movements Reflect Everything (Price Discount Everything)

According to Dow, the market has reflected all information available through prices. Price is an accumulation of all things, fear, hope and expectations of all traders. Likewise, the movement of interest rates, expectations of income, income projections, presidential elections, etc. all have been reflected in prices in the market. What has not been described is just an unexpected event, such as a natural disaster, but usually this will affect short-term trends. The main trend is not affected. The most important thing according to Dow is not what can cause prices to move now but what reactions might occur to current price movements.

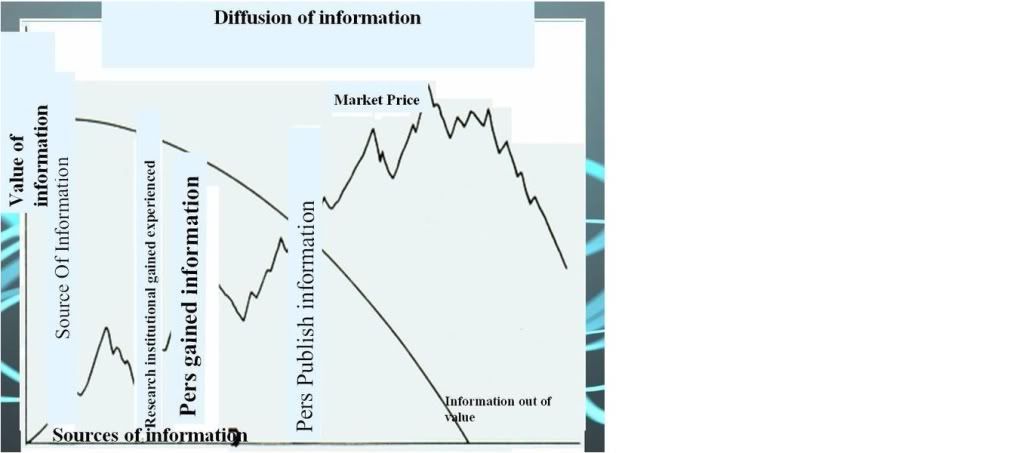
All information that has been reflected in price movements is in accordance with the theory of information diffusion. The diffusion of information is illustrated in the image below:


Quote
Spoiler title=SpoilerSpoiler:
Classical Technical Analysis Using Dow Theory in Technical_proxy


Another illustration can be exemplified when a company wants to release its financial statements, people who know information about the state of the company, of course, the people in the company itself, when they know the condition of a positive company, they will tell people nearby to buy shares of their company and the price will move up. Then came the auditors and the tax people, when they knew the condition of the company, they would take the momentum to buy the shares then the price would continue to move up.

The excitement of the press people gets the information, before the news release schedule, they will try to take advantage of the information obtained to participate in buying shares, and prices go up further which results in the reduced value of information.

When the news was released in various media, more and more people knew, so the value of information would be close to zero while prices still continued to rise. At this point, the first buyer begins to release the shares that they have bought for profit. Finally when many people sell because prices are considered high and the profits they feel are enough, then prices tend to turn down (reversal) and the value of information has really become zero. (Quoted from the article: The Dow Theory, Speaking The Truth About Technical Analysis, by: Aditya)

Sometimes anomalies occur in the market. Hamilton noted that sometimes markets will react negatively to good news. According to Hamilton, the reason is simple: the market looks forward, when the news will be released. This explains the old Wall Street axiom, "buy on rumors, sell on news".
#10 - February 23, 2019, 12:23:24 PM

  • Full Member
  • Posts: 110
  • Points: 0
  • Likes Received: 8
  • Reputation: +0/-0
A GLANCE ABOUT DOW THEORY

Dow Theory is the basic theory of technical analysis that was first published by Charles H. Dow (1851-1902) in 255 Wall Street Journal, Dow was a journalist and editor of Wall Street Jornal and founder of Dow Jones and Company. Dow's first research was conducted by dividing shares on Wall Street into 2 groups, namely the Industrial Index and the Transportation Index. He said that the development of the automated manufacturing industry would also be followed by the development of the transportation industry, because factories needed transportation to distribute their products.

Departing from the assumption that if the profits in the transportation industry increase then indirectly it also shows that the production of the manufacturing industry and demand from consumers also increases which in turn can drive the growth of profits of each company. Globally this can be used to measure the level of the economy of a country.

After Dow died there were several people who had a role in developing Dow Theory based on the writing written by Dow in the Wall Street Journal, including William P. Hamilton, Robert Rhea and E. George Schaefer.

Basic Dow Theory
1. The market has three movements
2. The trend has three stages
3. The stock market has absorbed all the news
4. The average stock market must confirm each other
5. The trend must be confirmed by volume
6. The trend is assumed to be valid until it gives a definite signal

The points above are used as a basis in technical analysis. These rules were stated by Dow and then refined by his successors.
Could you expalain about basic theory one by one so I can understand about the basic
#11 - February 23, 2019, 12:23:45 PM

  • Full Member
  • Posts: 110
  • Points: 0
  • Likes Received: 8
  • Reputation: +0/-0
b. Price Movements Reflect Everything (Price Discount Everything)

According to Dow, the market has reflected all information available through prices. Price is an accumulation of all things, fear, hope and expectations of all traders. Likewise, the movement of interest rates, expectations of income, income projections, presidential elections, etc. all have been reflected in prices in the market. What has not been described is just an unexpected event, such as a natural disaster, but usually this will affect short-term trends. The main trend is not affected. The most important thing according to Dow is not what can cause prices to move now but what reactions might occur to current price movements.

All information that has been reflected in price movements is in accordance with the theory of information diffusion. The diffusion of information is illustrated in the image below:


Another illustration can be exemplified when a company wants to release its financial statements, people who know information about the state of the company, of course, the people in the company itself, when they know the condition of a positive company, they will tell people nearby to buy shares of their company and the price will move up. Then came the auditors and the tax people, when they knew the condition of the company, they would take the momentum to buy the shares then the price would continue to move up.

The excitement of the press people gets the information, before the news release schedule, they will try to take advantage of the information obtained to participate in buying shares, and prices go up further which results in the reduced value of information.

When the news was released in various media, more and more people knew, so the value of information would be close to zero while prices still continued to rise. At this point, the first buyer begins to release the shares that they have bought for profit. Finally when many people sell because prices are considered high and the profits they feel are enough, then prices tend to turn down (reversal) and the value of information has really become zero. (Quoted from the article: The Dow Theory, Speaking The Truth About Technical Analysis, by: Aditya)

Sometimes anomalies occur in the market. Hamilton noted that sometimes markets will react negatively to good news. According to Hamilton, the reason is simple: the market looks forward, when the news will be released. This explains the old Wall Street axiom, "buy on rumors, sell on news".
Great master rendy,  I have new knowledge . But I want to ask you from part chapter 4 . Is fase 3 = fase ekses ?
#12 - February 23, 2019, 12:30:59 PM

  • Full Member
  • Posts: 104
  • Points: 0
  • Likes Received: 4
  • Reputation: +0/-0
Great master rendy,  I have new knowledge . But I want to ask you from part chapter 4 . Is fase 3 = fase ekses ?
Yes, the third phase is the excess phase, where in this phase the followers enter the market after seeing a strong trend in the participatory phase (second phase). Often in this excess phase, followers who are late in entering the market will experience loss because in this phase traders who enter the market in the initial phase have started to distribute (on the upward trend) back the shares they bought or accumulated (in the downtrend) back shares that have been they sell in the initial phase which results in a price correction.
#13 - February 23, 2019, 12:33:28 PM

  • Full Member
  • Posts: 104
  • Points: 0
  • Likes Received: 4
  • Reputation: +0/-0
c. Linkage between Price Movements between Sectors

When Dow's theory was developed at the turn of the 20th century, railroads had an important link in the economy as a means of transporting material supplies from raw material suppliers to producers (industries) and at the same time as a means of transportation to distribute production. Before General Motors can increase production, steel first needs to be transported. Therefore, an increase in transportation business is a sign of increasing industrial business activities. Thus when there is an increase in operating profit which triggers an increase in stock prices in the transportation sector, a similar increase in the industrial sector will also be followed.

Dow and Hamilton emphasized that the main trends in buying or selling signals were valid, when both the Industrial Average and Transportions (Rail) Avarage confirmed each other. If one of them makes a "new high or new low", then the other must be followed immediately. This is a valid signal according to the Dow theory.

Spoiler: Show


Quote
Spoiler title=SpoilerSpoiler:
Classical Technical Analysis Using Dow Theory in Technical_proxy

#14 - February 23, 2019, 12:34:32 PM

  • Full Member
  • Posts: 104
  • Points: 0
  • Likes Received: 4
  • Reputation: +0/-0
5. Relationship between Volume and Trend

Dow said, volume is one of the important components in the movement in the market, in the bullish trend, it should also be followed by increasing the volume and so when the correction occurs, it should be followed by a decrease in volume.

Volume in market movements, shows the participation of the public (trader) and at the same time also describes an increase in market confidence in a stock when there is an increase in prices accompanied by an increase in volume on the stock. When the bullish trend decreases in volume, it indicates there has been a weakening in the trend and investors have been prepared to take profit which can make a correction move or even a reversal next time.

In addition, the volume also illustrates the strength of supply and demand for a stock as a mirror of the strength of buying interest and selling interest. The upward trend which is still followed by increasing volume or at least followed by stable volume, indicates that there is still more demand or buying interest in a stock.

However, Dow said the volume was not used to predict the direction of the trend, but was used to confirm price movements, "Volume must confirm the trends". He also reminded that without being supported by the volume of volume movements that are in line with the trend of price movements, we do not have to trust the direction of the movement of the market. It can be concluded that volume can be used to measure whether the trend will continue or will change.


Quote
Spoiler title=SpoilerSpoiler:
Classical Technical Analysis Using Dow Theory in Technical_proxy

#15 - February 23, 2019, 12:35:21 PM

Members:

0 Members and 1 Guest are viewing this topic.