Forex Zone - Forex Forum

Bitcoin (BTCUSD) in Technical_6825f0acc9f09

Bitcoin (BTCUSD)

Discussion started on Technical

Administrator
  • Hero Member
  • Posts: 5428
  • Points: 29952
  • Likes Received: 5292
  • Reputation: +220/-14
Bitcoin re-tested the line perfectly as expected. Bitcoin should now keep falling down to the $75000 area.

Bitcoin is currently $96000. So this means Bitcoin should fall an additional 22% from here.
#31 - December 22, 2024, 02:31:02 PM

Administrator
  • Hero Member
  • Posts: 5428
  • Points: 29952
  • Likes Received: 5292
  • Reputation: +220/-14
Bitcoin has a Head & Shoulders Pattern pending on the Daily chart. If the neckline breaks, BTCUSD should fall to $76000.

This is very close to my previous analysis on the H4 and Weekly charts. All 3 charts are in agreement with each other.

Bitcoin (BTCUSD) in Technical_topic=895
#32 - December 29, 2024, 04:48:57 PM
Attachments:

Administrator
  • Hero Member
  • Posts: 5428
  • Points: 29952
  • Likes Received: 5292
  • Reputation: +220/-14
Bitcoin (BTCUSD) in Technical_topic=895

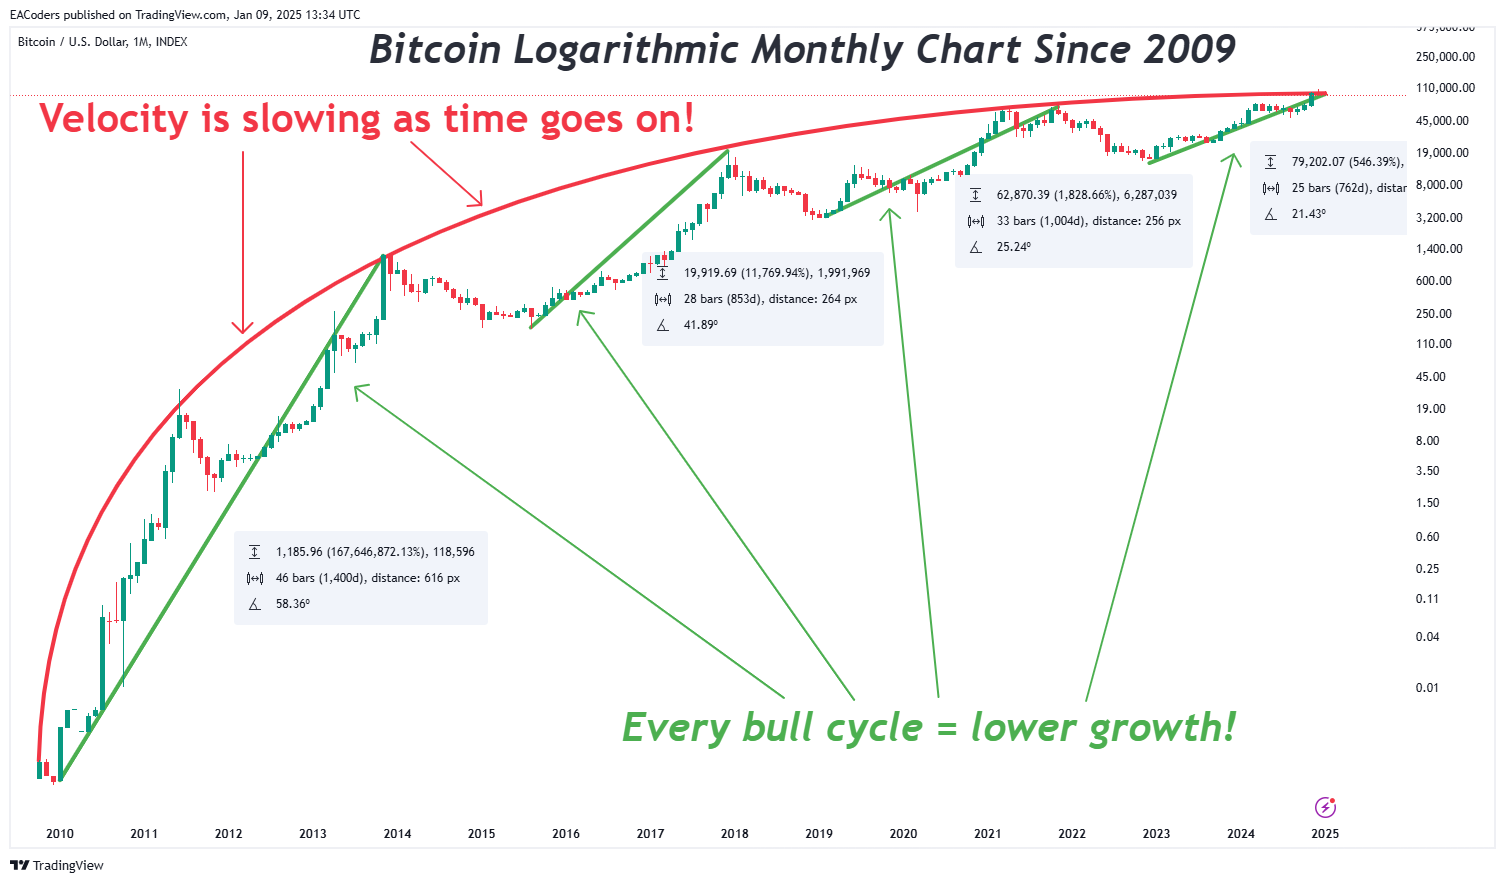
Bitcoin is currently in a bull cycle similar to previous cycles. Bitcoin has a notorious 4 year cycle that almost everyone knows about due to it's halving. This means the current bull cycle should extend into late 2025. However, things may be a little different from what most people would expect this time.

This is an all-time Bitcoin logarithmic chart going back to 2009 which is when Bitcoin was released. This is a monthly chart so all the information can fit onto a single screen.

The red line shows a trajectory similar to an airborne projectile of some kind. As time goes on, the velocity is slowing. We all know what happens next when velocity slows down too much. Gravity takes over!

The green lines were drawn from the lows to the highs. I realize they may be off by a candle or so depending on data source or where somebody want to put the start/end times, but this doesn't change the overall concept. Every bull cycle has lower growth in terms of %. This is just a fact.

There are 3 important notes I want to make other than slowing velocity:

  • Bitcoin is already extended up to the red line this cycle. Which just so happens to coincide with the strong psychological $100000 level.
  • Notice how the growth percentages are drastically lower each cycle. Bitcoin is currently up more than 500% from it's low point this cycle. The previous cycle only made a 1829% move. So the high for this cycle may have already been made.
  • We are about 25 candle into the current cycle. Each cycle has different durations from low point to high point though. The shortest cycle was only 28 candles. Bitcoin may very well have made it's high point this cycle already. If not, there may be only a few months left of bullish movement.

See my previous analysis using a regular linear chart which I made near the top. Both long-term charts are in agreement.
#33 - January 09, 2025, 01:39:17 PM
Attachments:

Sponsored

Bitcoin (BTCUSD) in Technical_6803a6c52eb12
#34 - Today at 11:04:02 AM

VIP
  • Hero Member
  • Posts: 19497
  • Points: 3496
  • Likes Received: 236
  • Reputation: +4/-0
Buyers have now started to put up resistance to Bitcoin, we can see this from the formation of bullish candles on the daily time frame. I think Bitcoin will rise again at least to a price of 93326.40.
#34 - March 01, 2025, 02:48:19 AM
Attachments:

Administrator
  • Hero Member
  • Posts: 5428
  • Points: 29952
  • Likes Received: 5292
  • Reputation: +220/-14
My Bitcoin target of $75000 which I mentioned in some previous posts was hit earlier today.

I started calling for a big drop back in December when Bitcoin was at it's high near $107000!
#35 - April 07, 2025, 04:01:41 PM

Members:

0 Members and 1 Guest are viewing this topic.


Elementor Website Builder